2023 Q4 Market Report
January 22, 2024
REPORT COMMENTARY
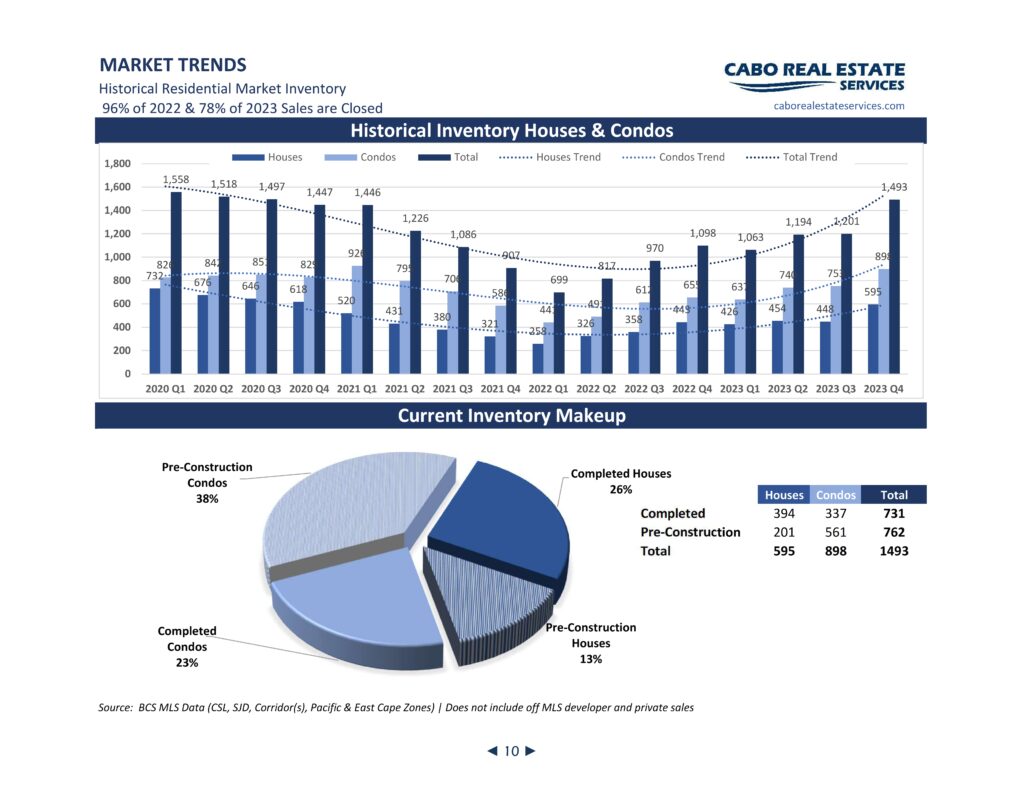
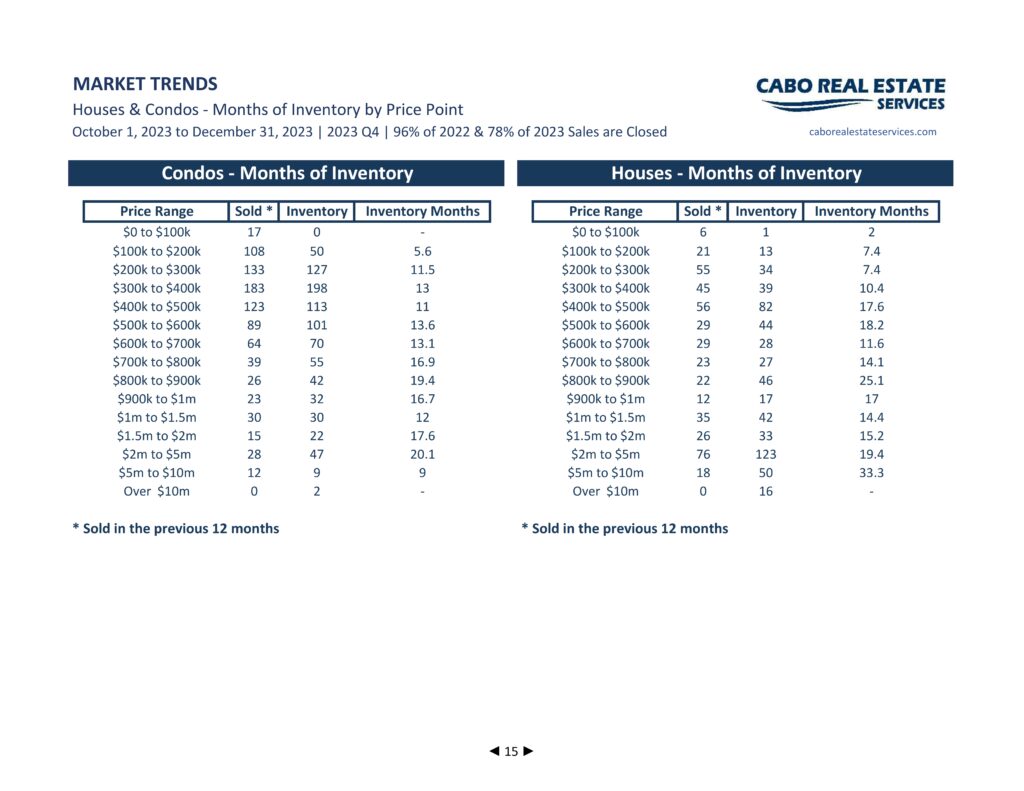
We’ve rung in a new year and the Los Cabos Market remains interesting. The 2024 market has brought the highest inventory levels since 2020 Q3 with 1,493 houses and condos for sale. A significant portion of the current inventory, over half, remains pre-construction with 762 houses and condos. With inventory on the rise, we have added new reporting on Inventory Months on Page 15.
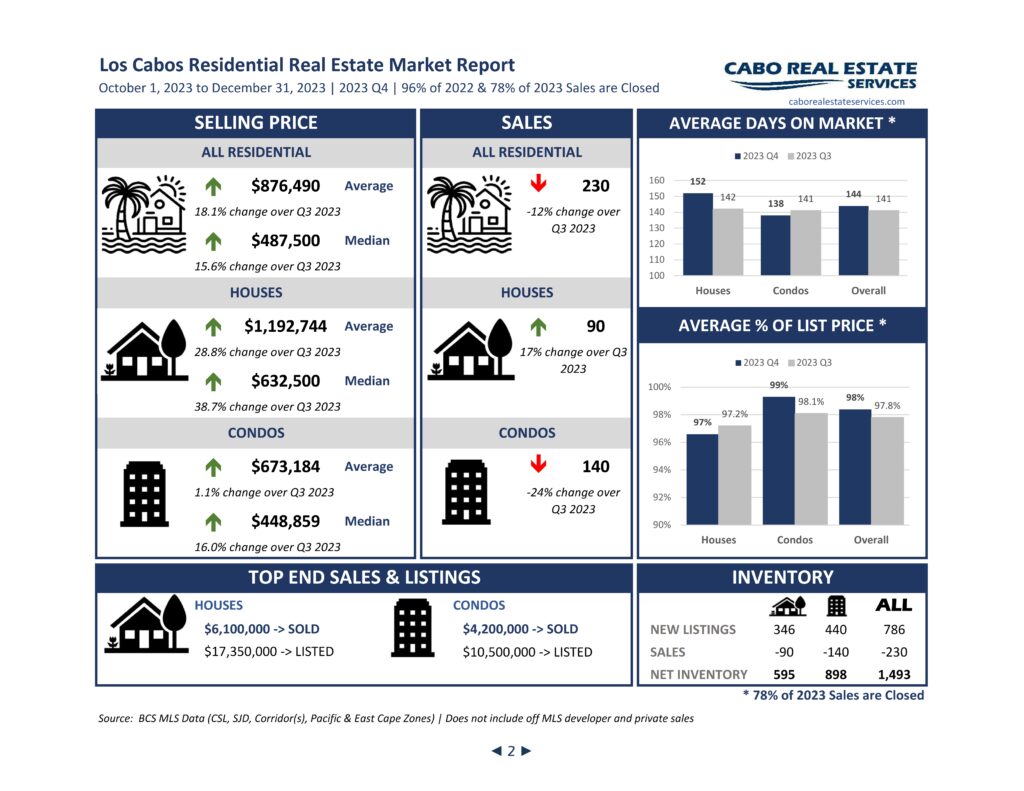
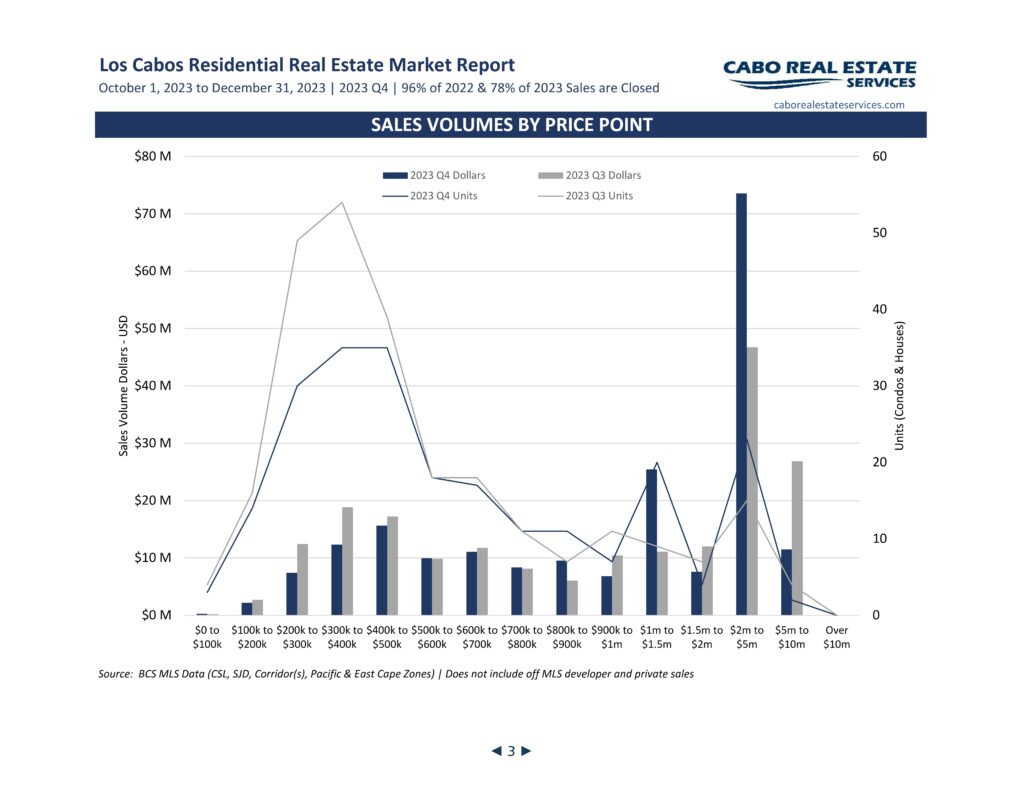
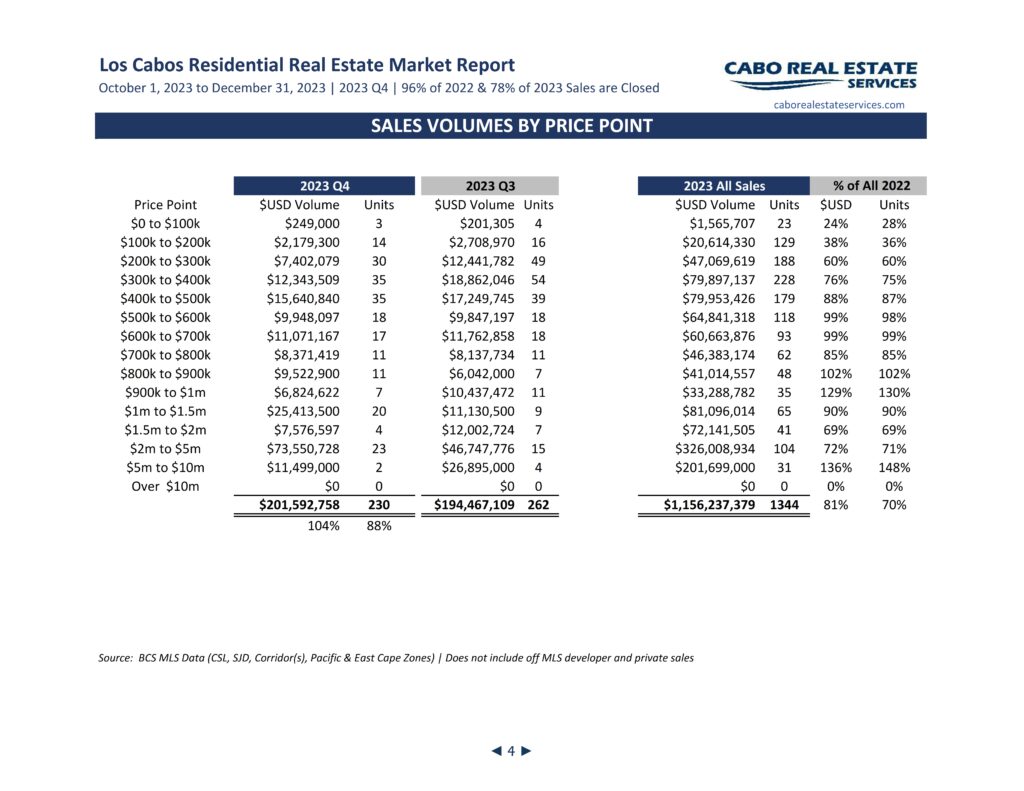
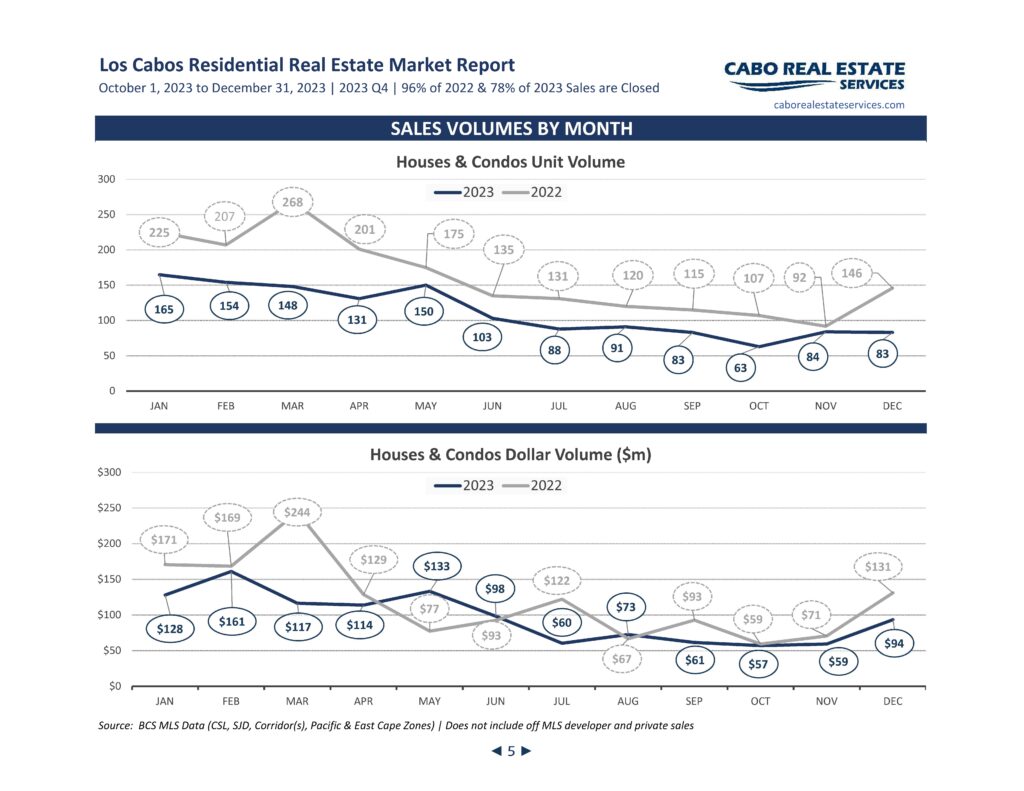
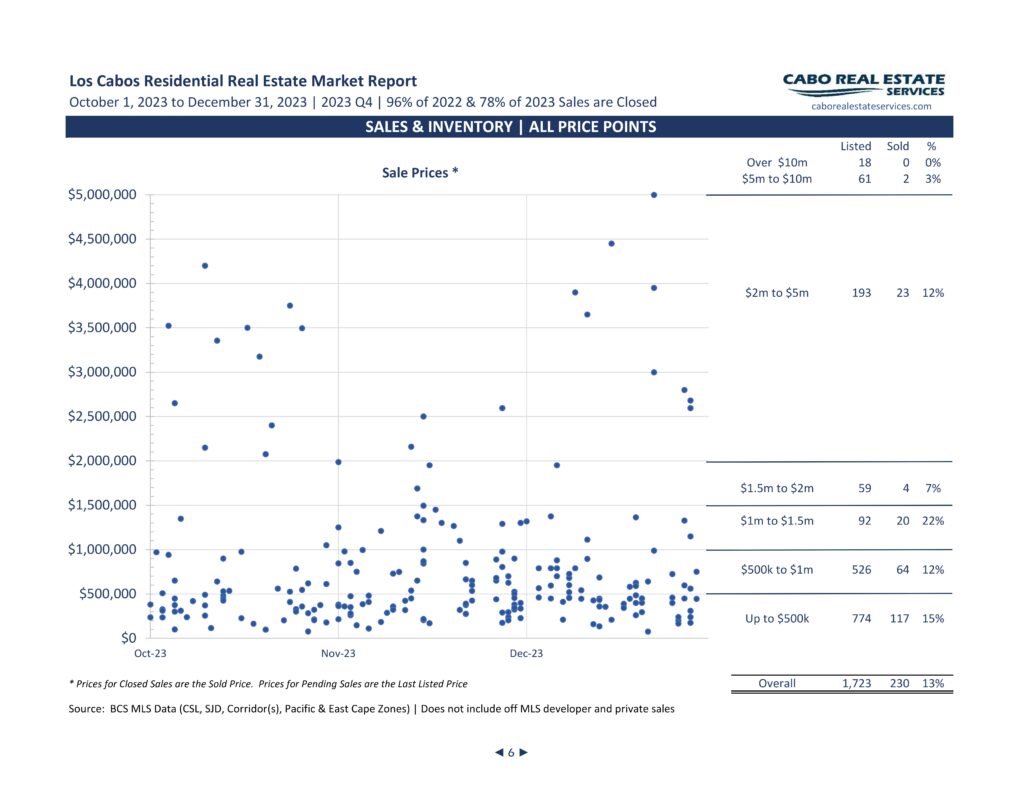
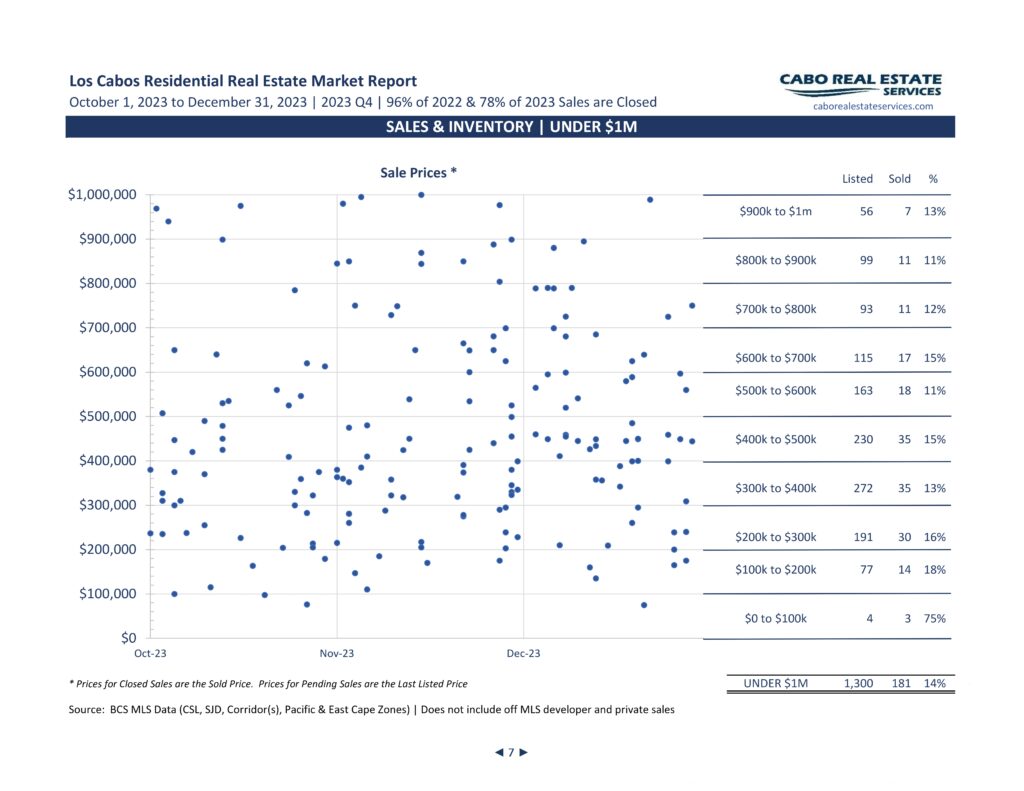
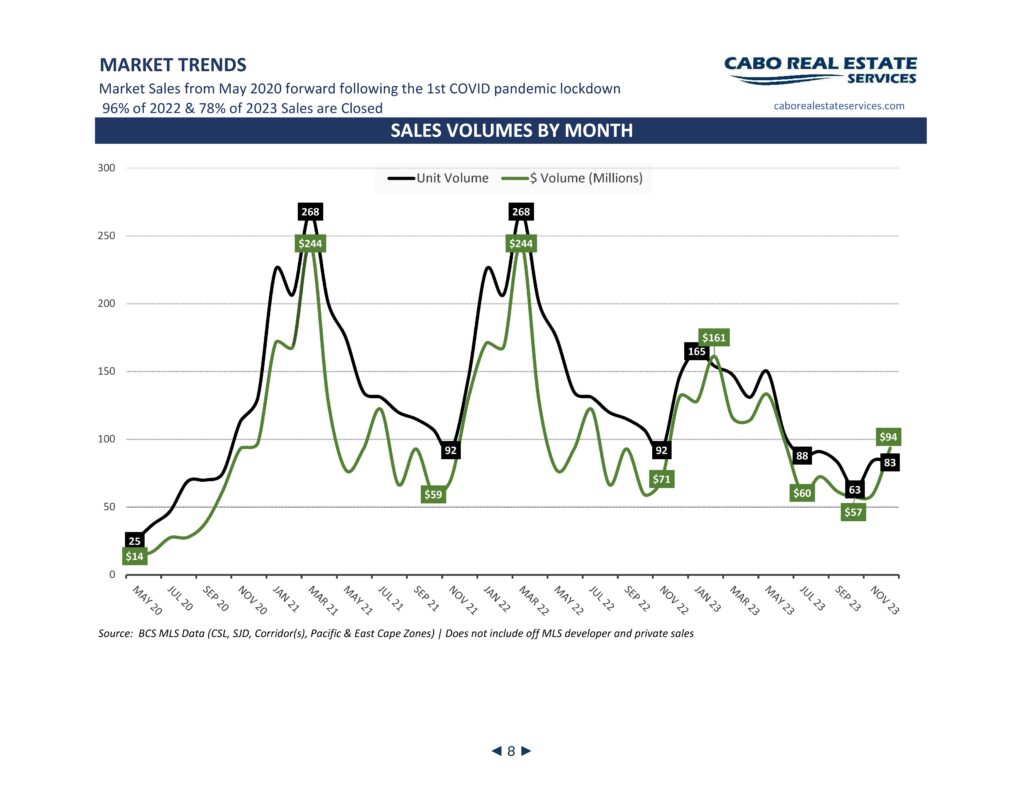
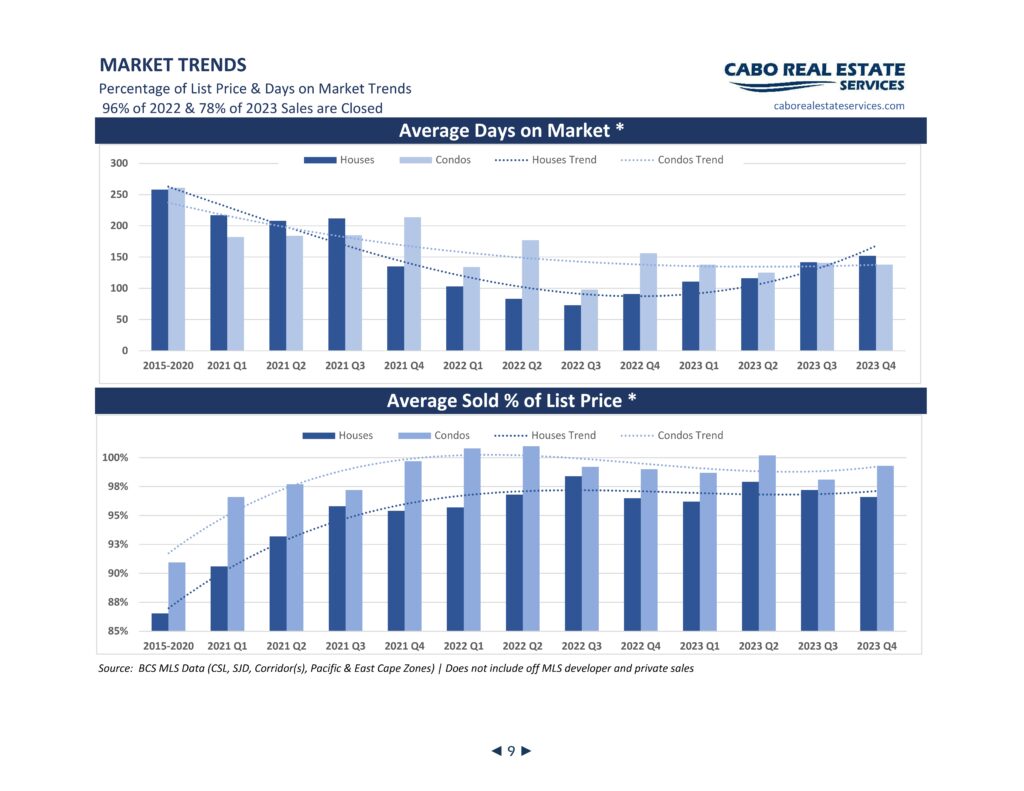
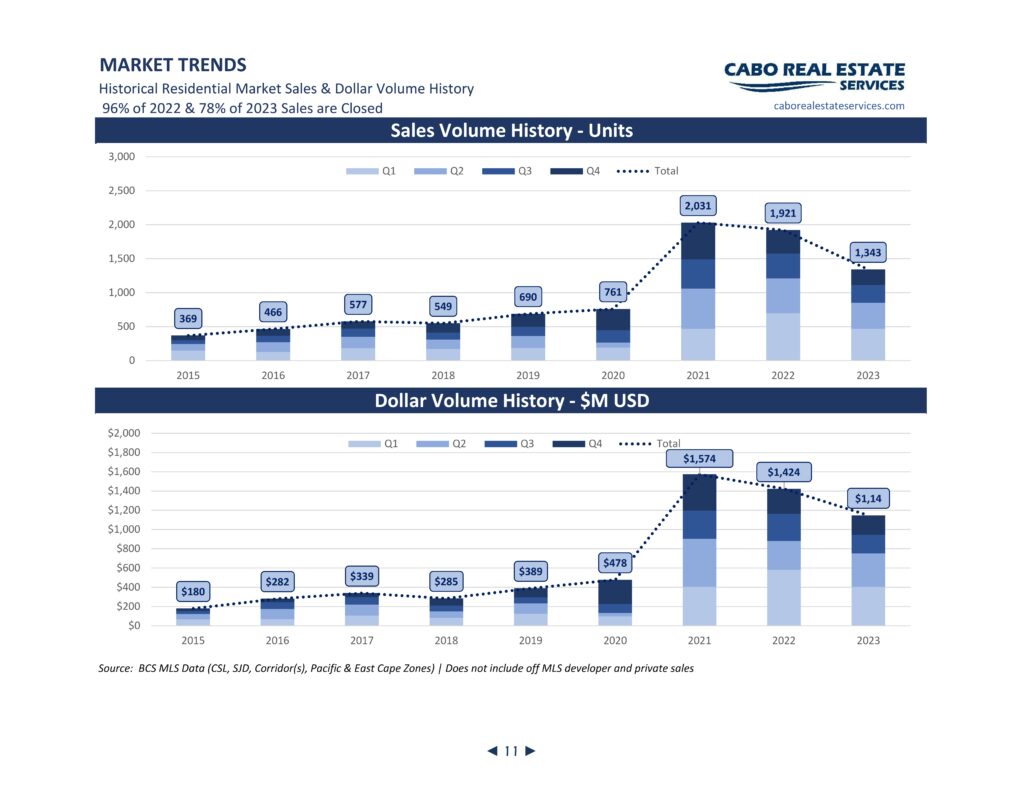
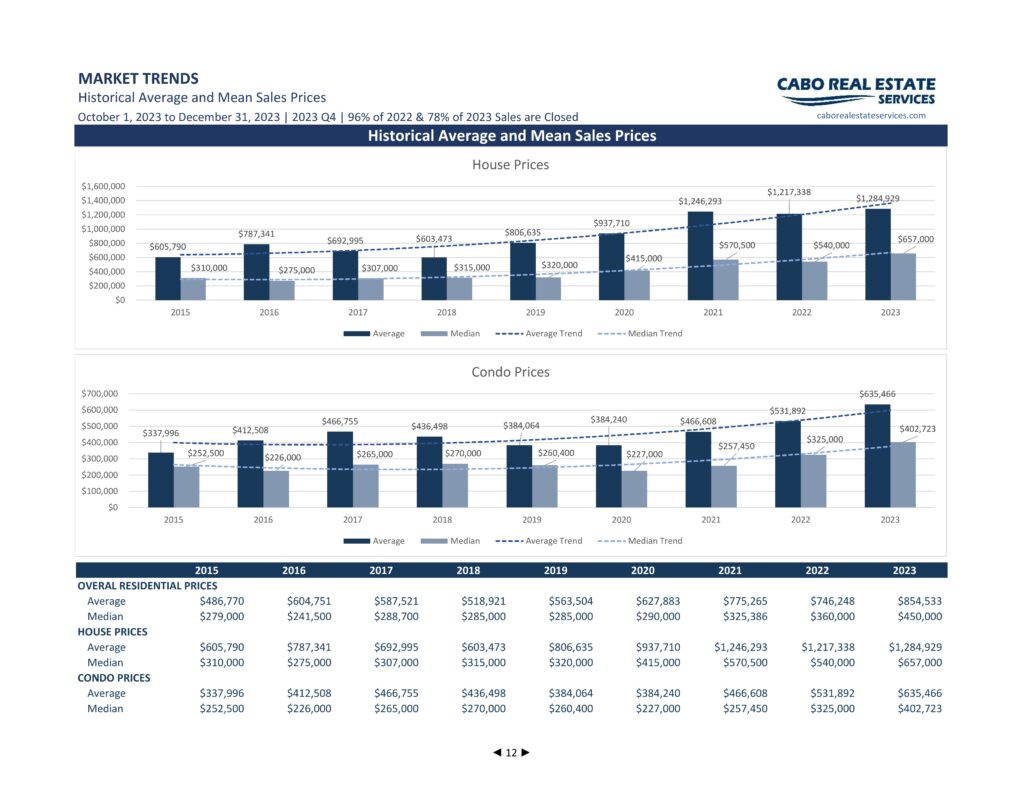
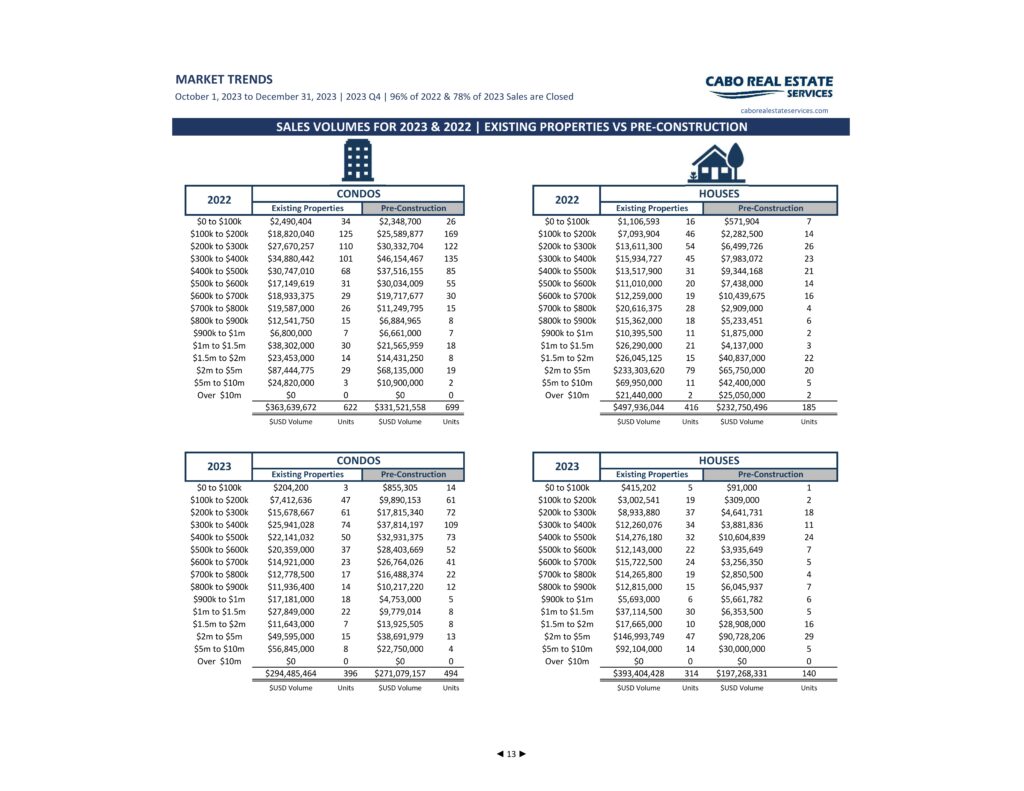
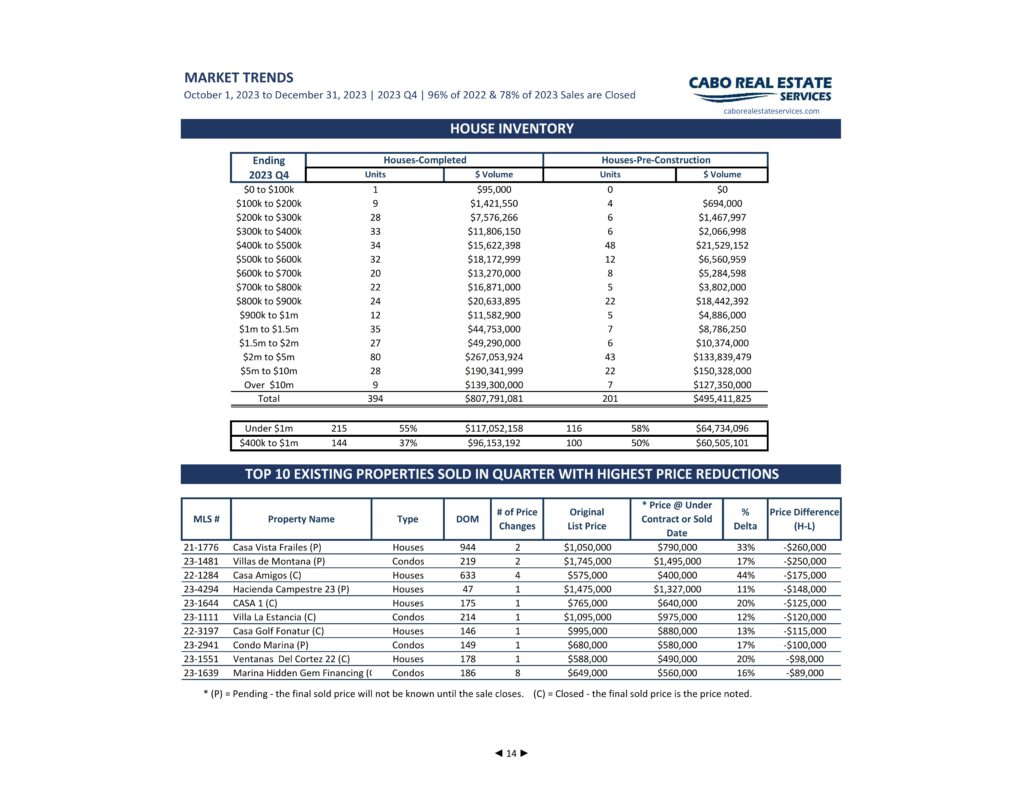
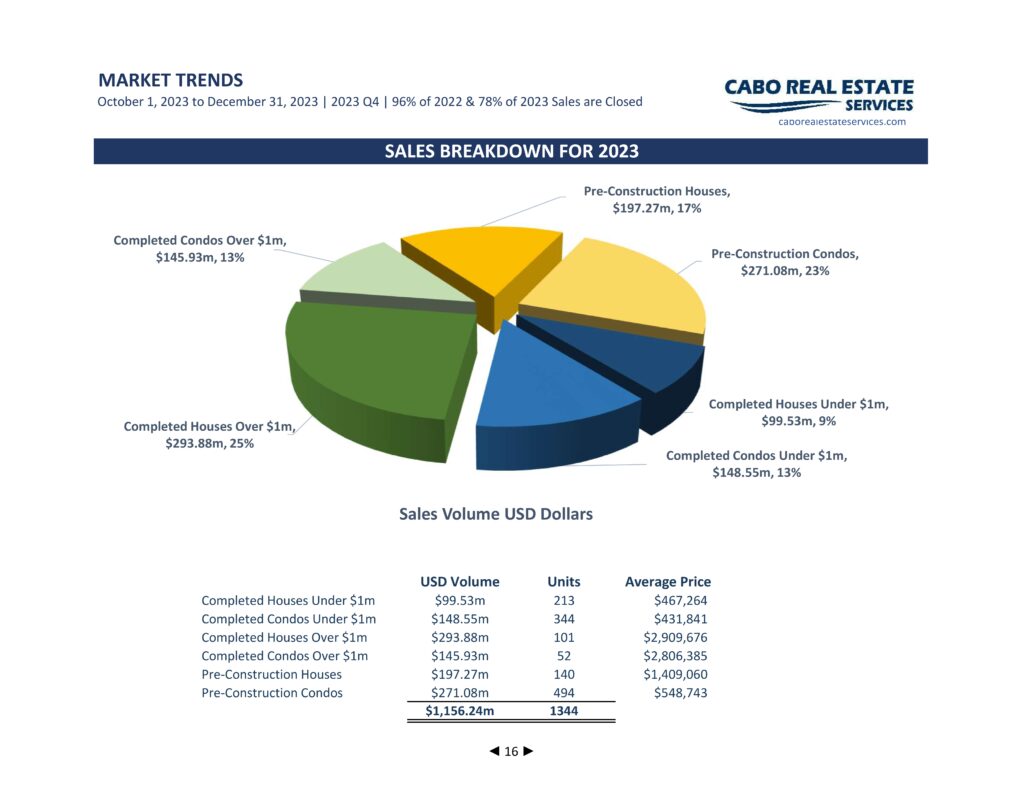
The market picked up some in Q4 from a slow summer Q3 coming in with a sales dollar volume of $201.5m. Sales volumes are down by 12%, with 231 houses and condos sold. The $2m to $5m price point again remains the market hot spot with $73.5m and 23 houses and condos sold. The $300k to $400k and $400k to $500k price point were the leaders in terms of unit volume with 35 houses and condos sold each for a total of $28m. Prices held in Q4 with the average house price rebounding by 28% and the median house price rebounding by 38%. Condo prices responded with smaller price gains. Days on Market, particularly for houses, is on the rise with average DOM at 152, the highest since Q3 2021.
LOS CABOS MARKET DIRECTION
Buyer interest in the market has waned some and with rising inventory and increasing Days on Market, the market looks to be turning a corner. It’s not a buyer’s market yet, but at certain price points it’s heading that way. With interest rates declining in the US and Canadian Real Estate markets, both buyers and sellers are getting back in the market. Expecting this to rub off, we see demand returning in Los Cabos.
NEW IN THIS REPORT
Inventory Months by Price Point – With inventory rebounding, we have added statistics to understand how long it could take to clear inventory at various price points. The math per price point is [Inventory Units] ÷ ([Units sold in the past 12 months] ÷ 12). In the $2m to $5m Price Point, there were 76 houses sold in the last 12 months and the present Inventory is 123 houses the math is 123 ÷ (76 ÷ 12) = 123 ÷ 6.3333 = 19.4 months to clear the inventory. Go to Page 15 to see the results.