2023 Q2 Market Report
July 9, 2023
REPORT COMMENTARY
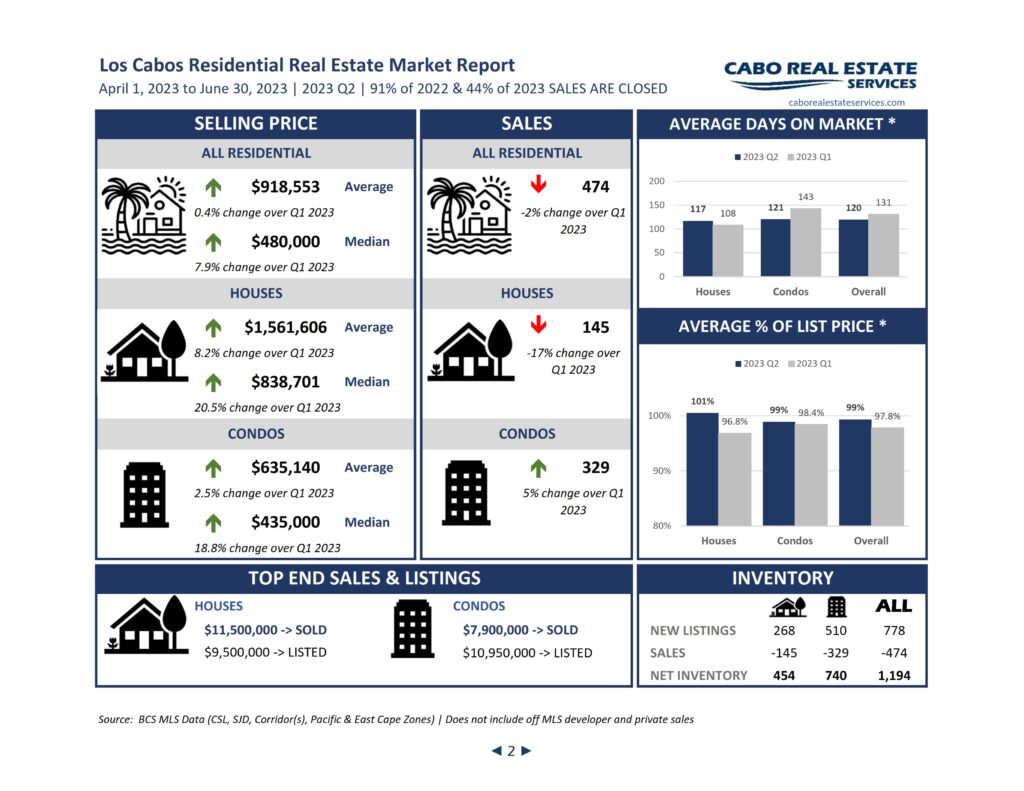
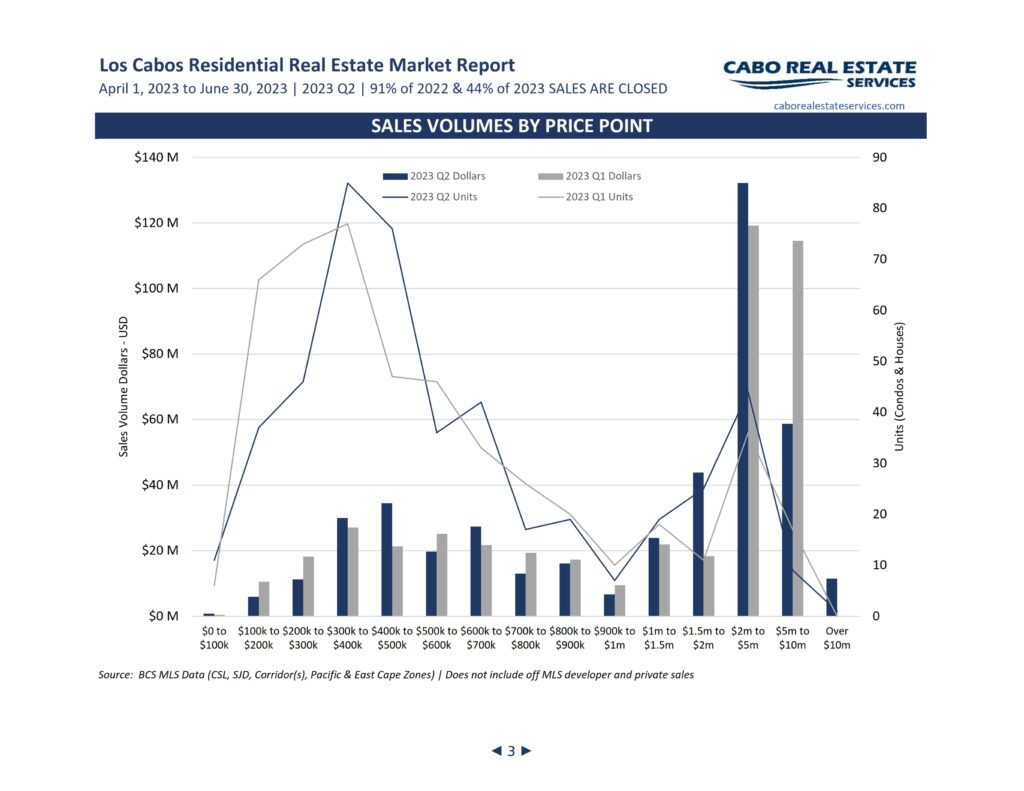
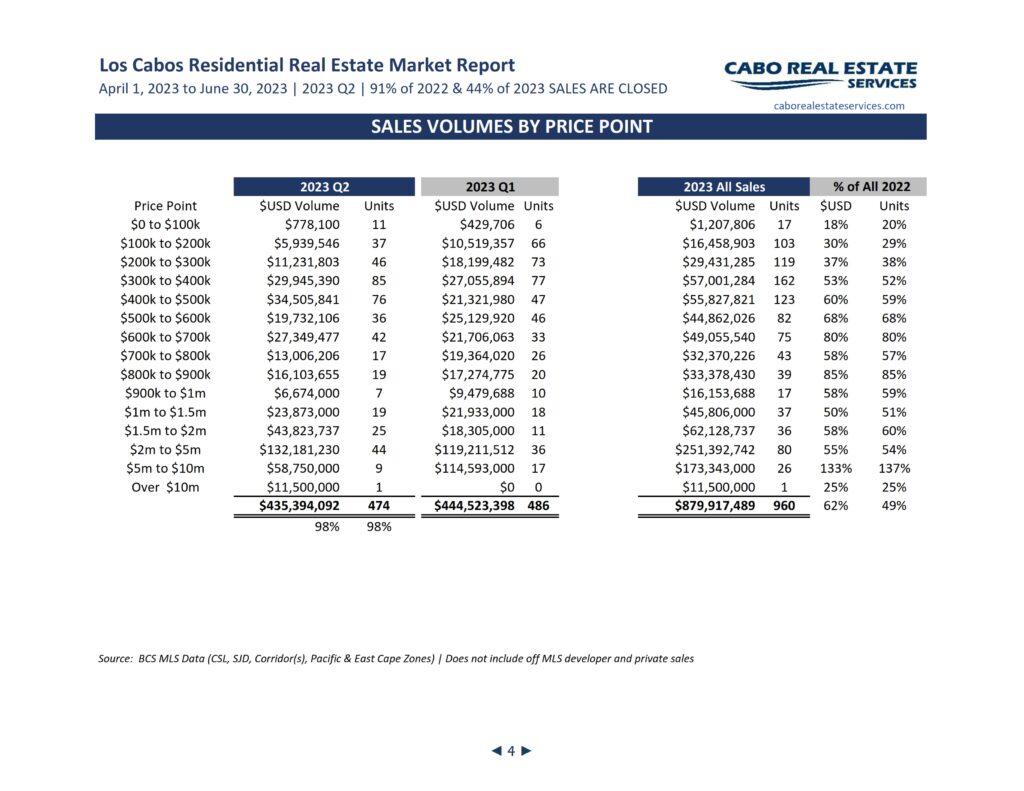
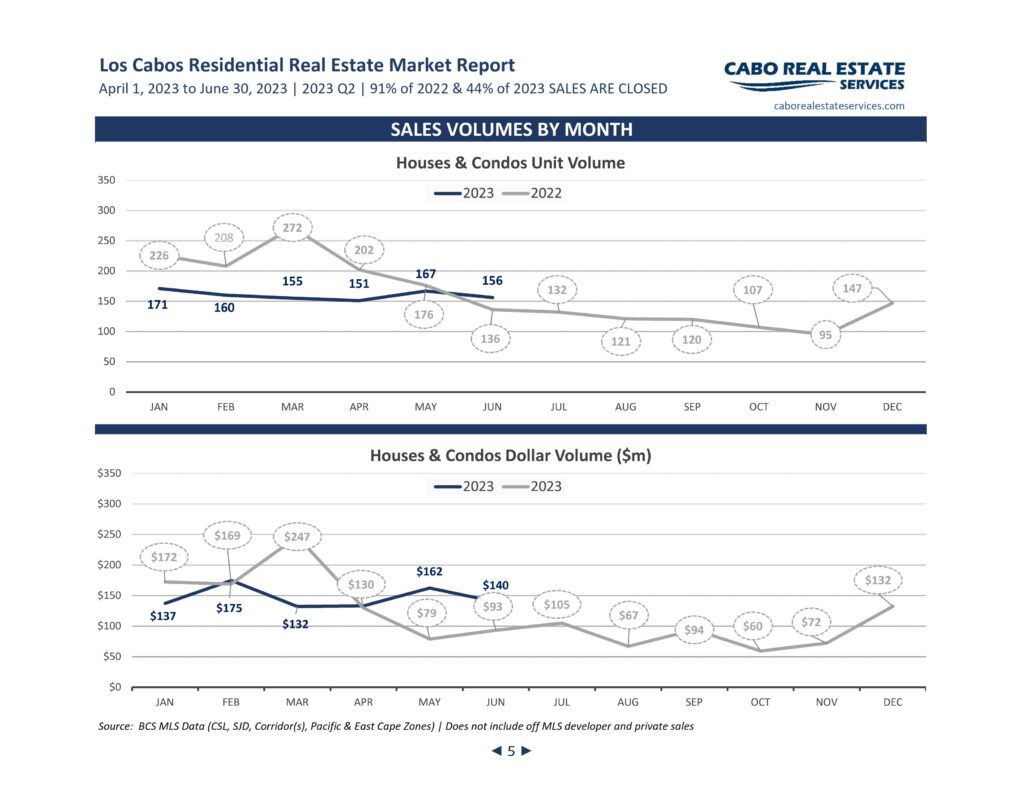
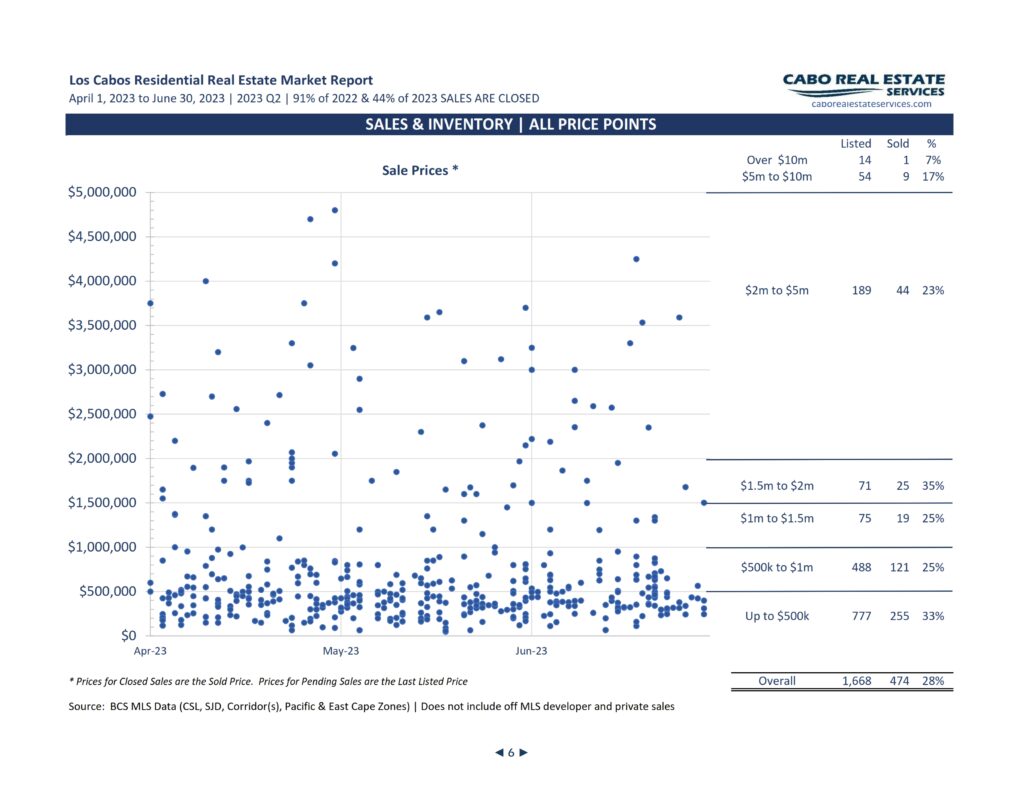
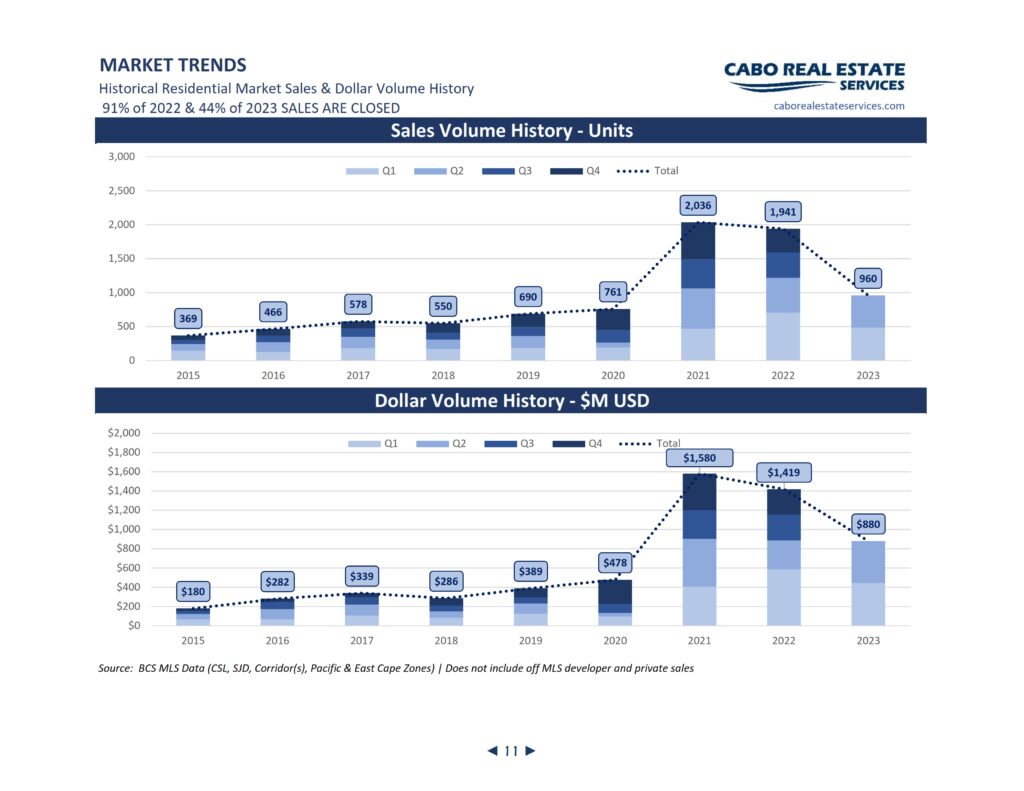
The midpoint of 2023 is upon us, and the market hasn’t slowed down much with Q2 coming in just under Q1 with sales volume of $435m. Sales volumes are down by 2%, with 474 houses and condos sold. The $2m to $5m price point remains the market hot spot with $132m and 44 houses and condos sold. Pre-construction remains sought after with just over 50% of the unit volume and 43% of the dollar volume in Q2 going to pre-construction sales.
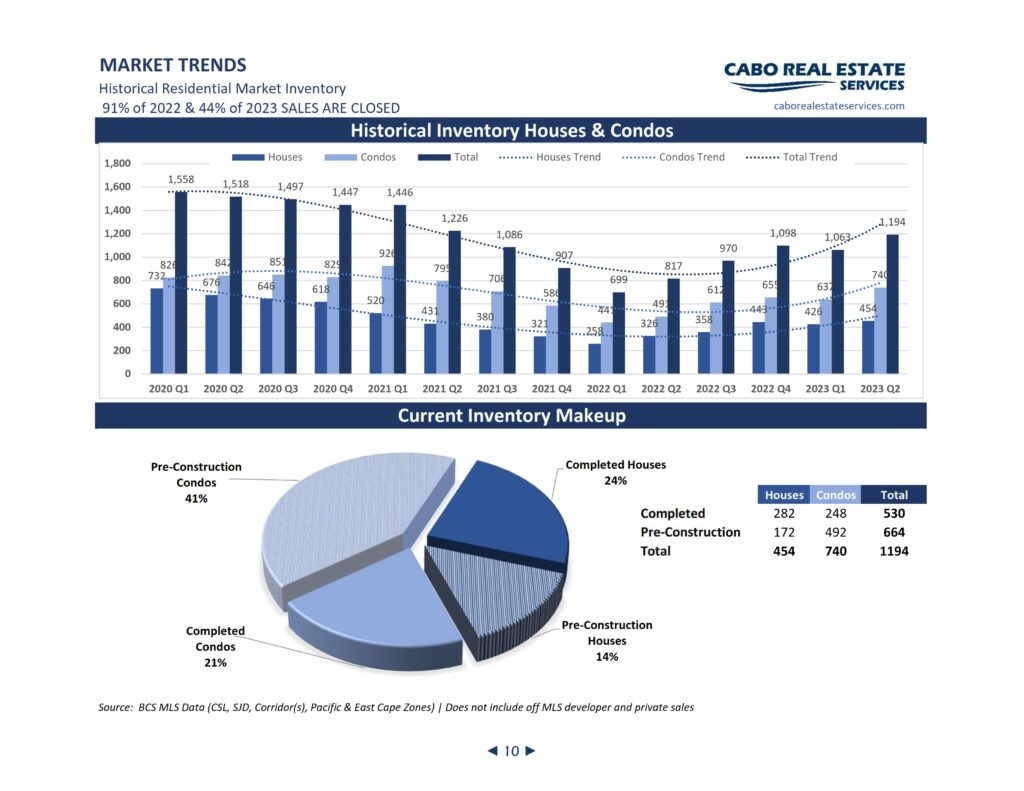
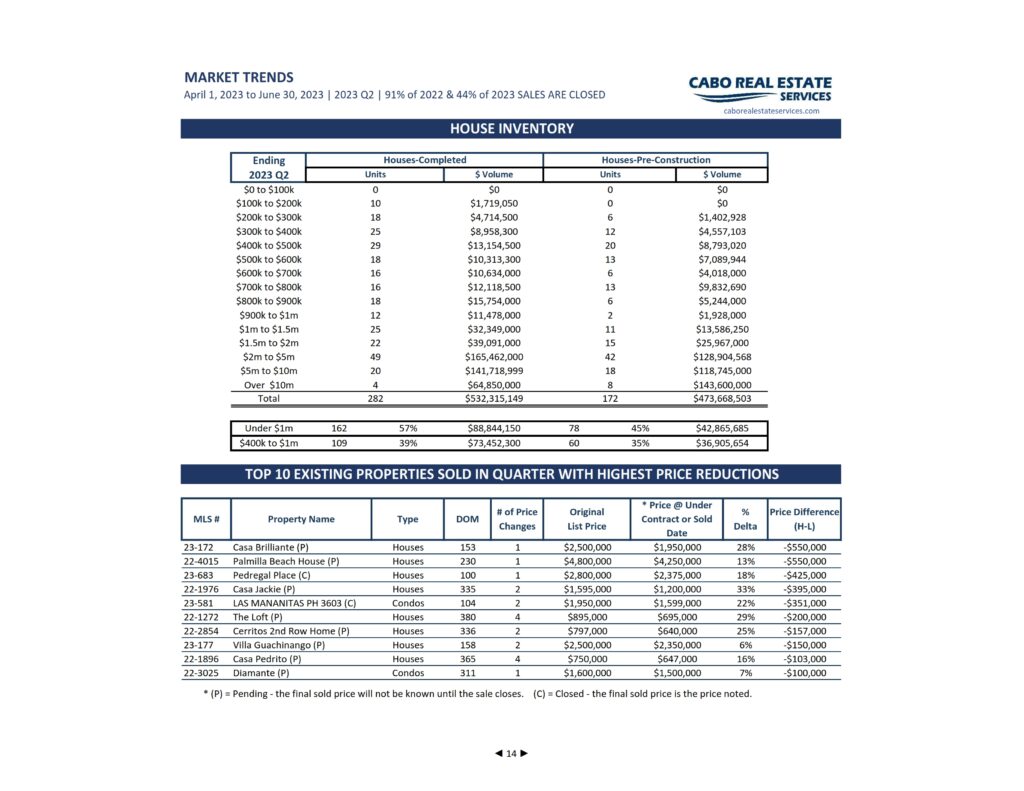
In Q2, inventory overall improved, both physical inventory and pre-construction listings. Pre-construction again dominates inventory, with over half of all MLS listings being pre-construction. With respect to shortage of houses at particular price points, the under $500k price point has additional options with the start of Phase II of Las Misiones in El Tezal.
LOS CABOS MARKET DIRECTION
With both the US and Canada staving off recessions and real estate markets there on the rebound, we see demand remaining strong in Los Cabos particularly in the over $1m range. In addition, thanks to the “Super Peso”, the strongest Peso in 7 years, Mexican investors interest in Los Cabos is growing.
NEW IN THIS REPORT
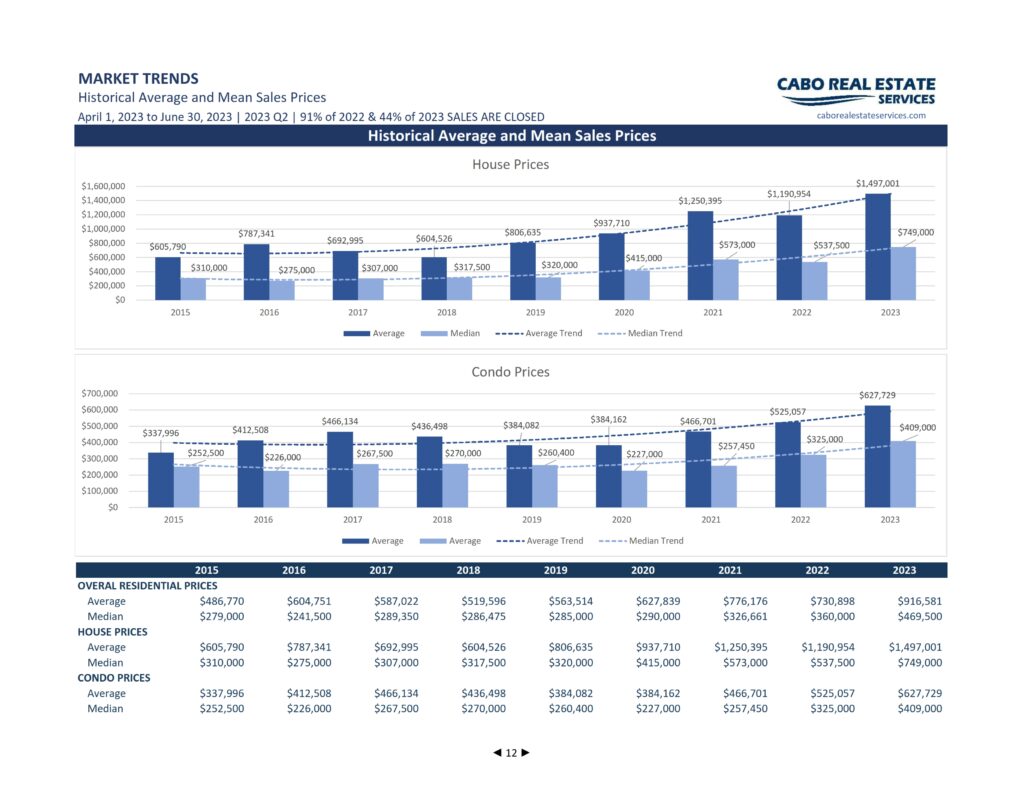
Historical Average & Median Prices – We have charted on P2 the values by quarter of the Average and Median Prices for Houses and Condos but until now had yet to show the trend. On P12 we have included these values from 2015 forward including 2023 year to date. Average (or Mean) is the arithmetic average of sold prices. Median is the middle value in the distribution of prices where an equal number of units sold are below the middle and an equal number are above.
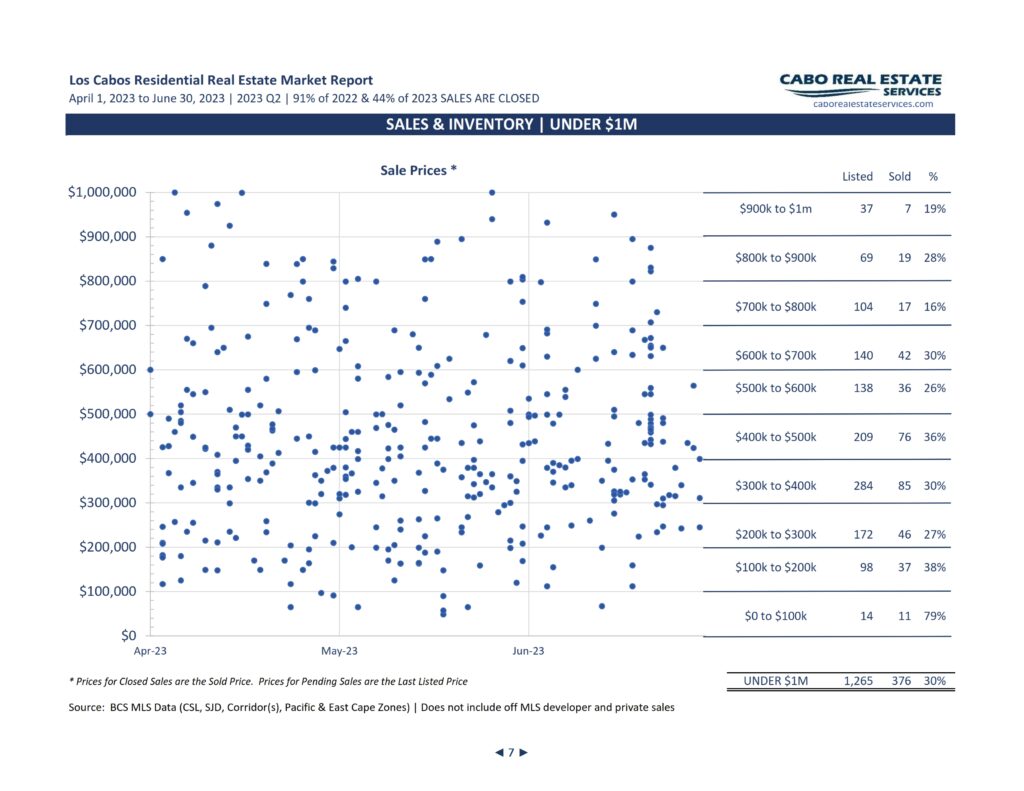
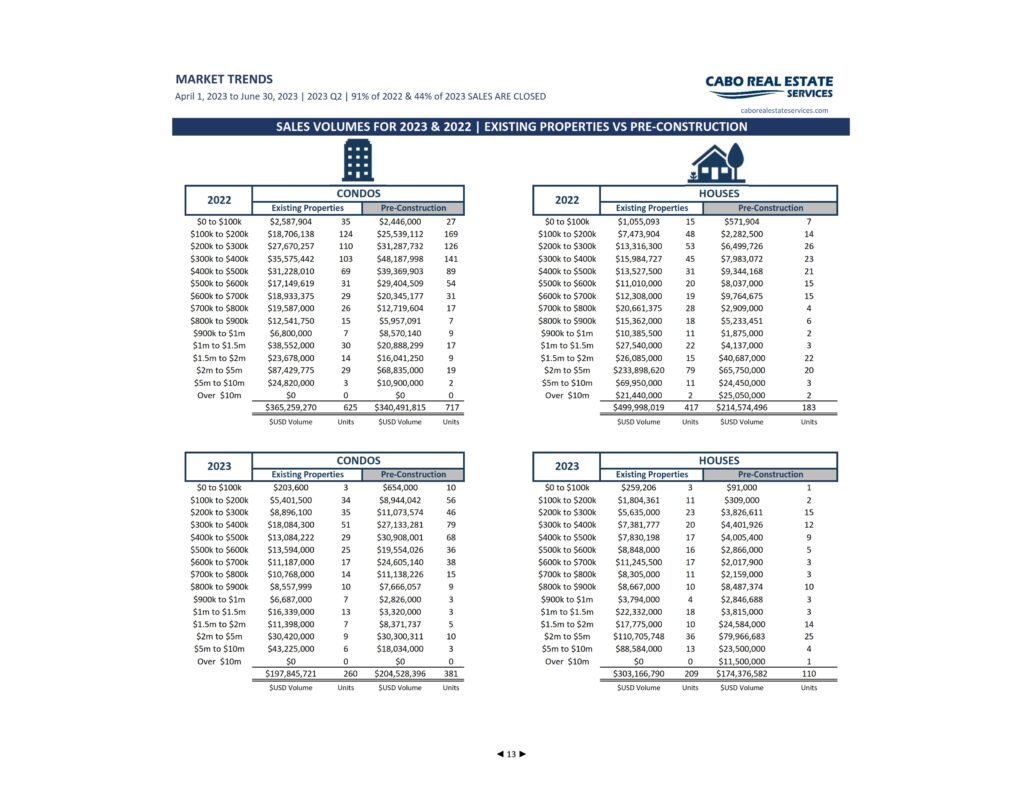
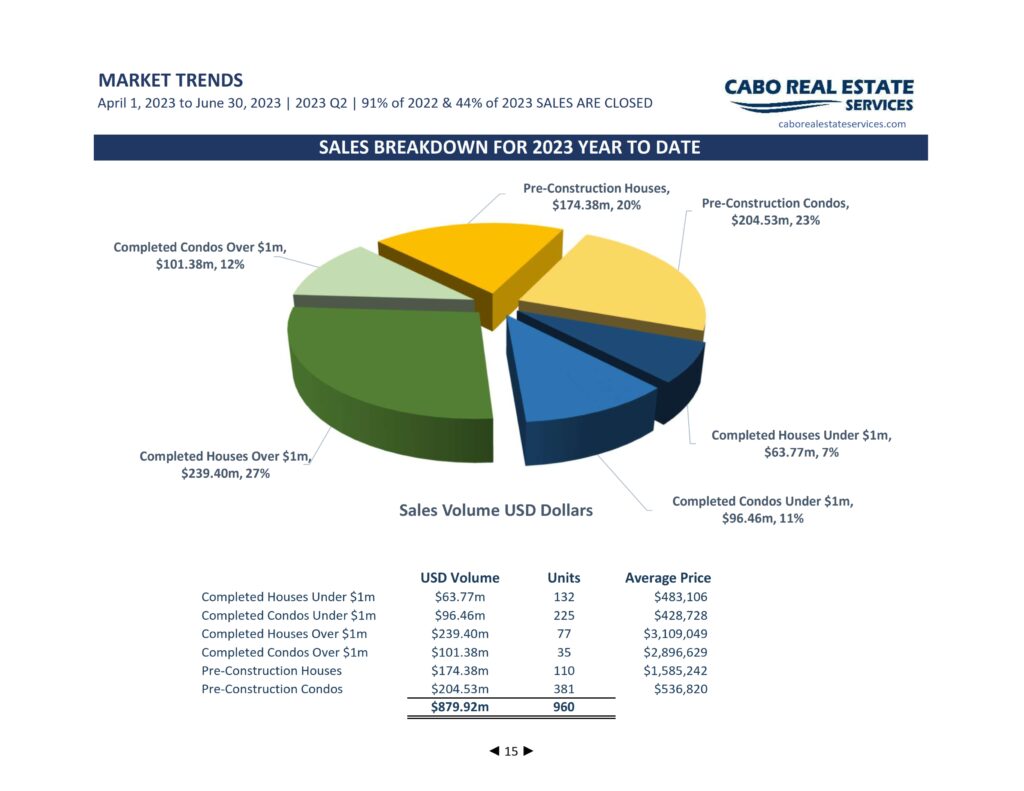
Sales Breakdown for 2023 Year to Date – We have broken down the market into different slices to shed light on the small proportion that completed houses and condos under $1m USD represents. Completed properties under $1m is only 18% of the market. This also highlights the proportion of completed properties over $1m USD, 39% and Pre-Construction, 43%.
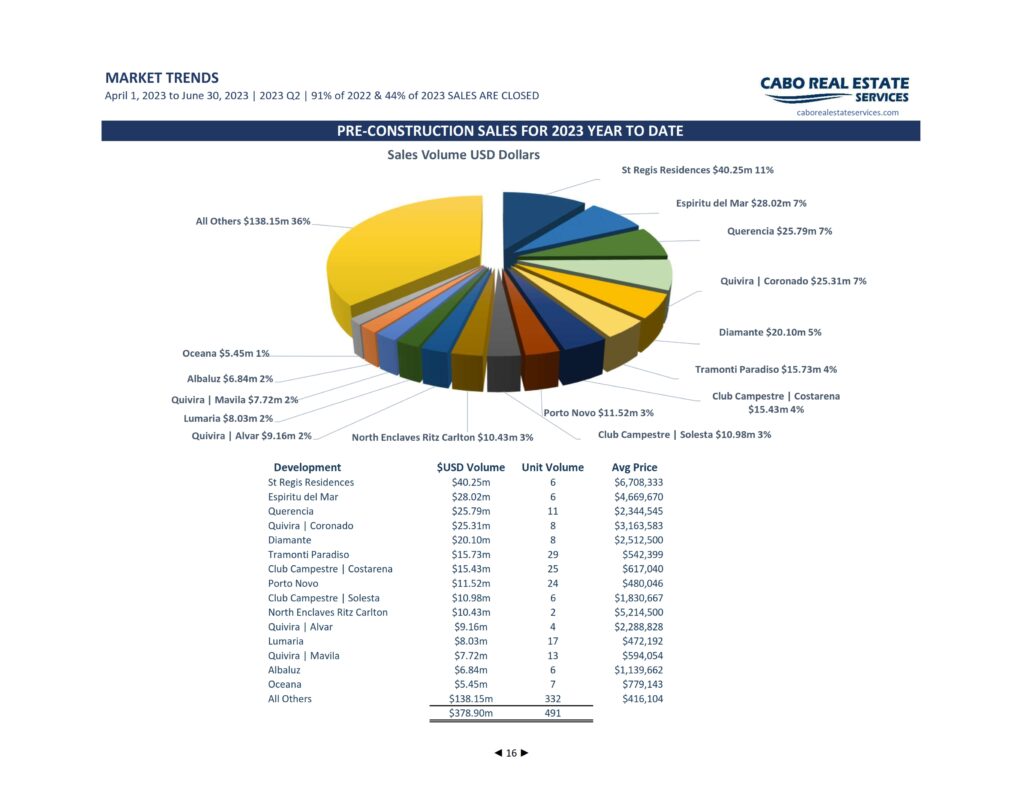
Pre-Construction Sales to Date – With Pre-Construction shaping up as almost half the market activity on MLS, our new chart on P16 is showing where all the money is going.